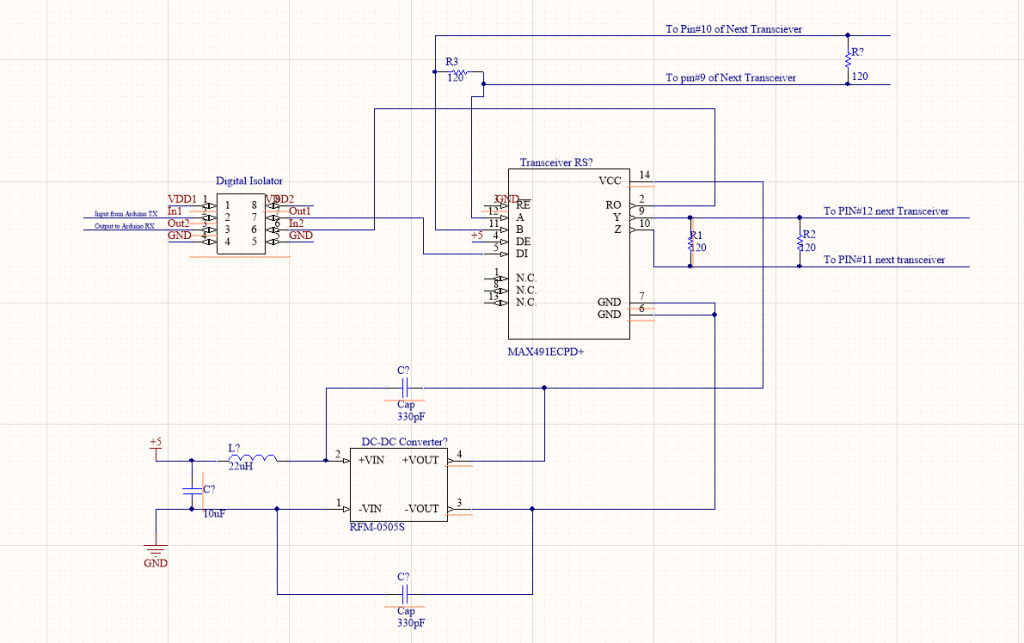
The difference between the new one and the previous schematic would be I added 4 120 ohm resistors (R1, R2, R3, R4) from the outgoing side (PIN#9 and #10) of transceiver and incoming side (PIN#12 and #11) of the transceiver.
So far it looked like I managed to transmit 1Mbps over 1000 foot UTP cables, however at this point I can’t confirm whether the signal I transmitted was smooth or mostly jitters. I still need to figure out how to set up the eye-diagram with external trigger. Will keep you posted!.
It’s been a while since my last post. I actually did a little summer activities (hiking, gardening, rearranging pantry, making soap etc). BUT I also managed to design the circuit schematic for my serial communication project.
The schematic as shown in Figure 1 is very drafty. I was using Altium Designer for it, but since I am not making PCB at this moment, I thought this should be doable as my breadboarding reference. Again, this schematic is awful because you can’t really see the flow from the original to the isolation section. I will fix it later!
Fixed: latest schematic
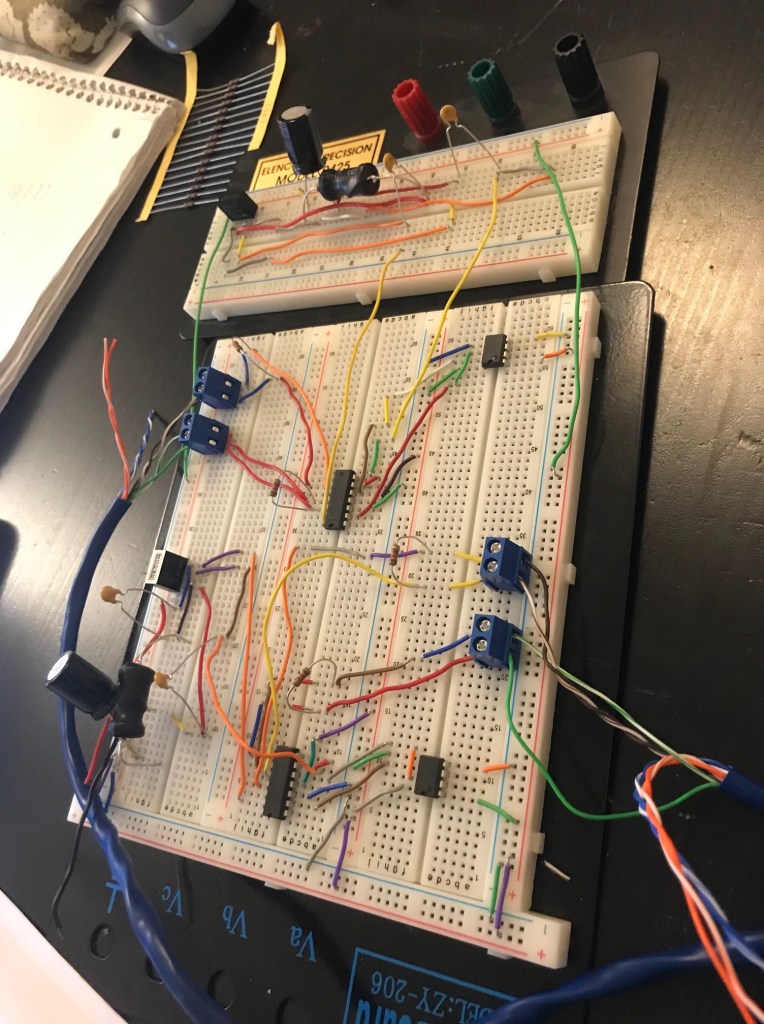
Breadboarding part I: Look at those loops!
Figure 2: Bread-boarding based on the schematic from Figure 1
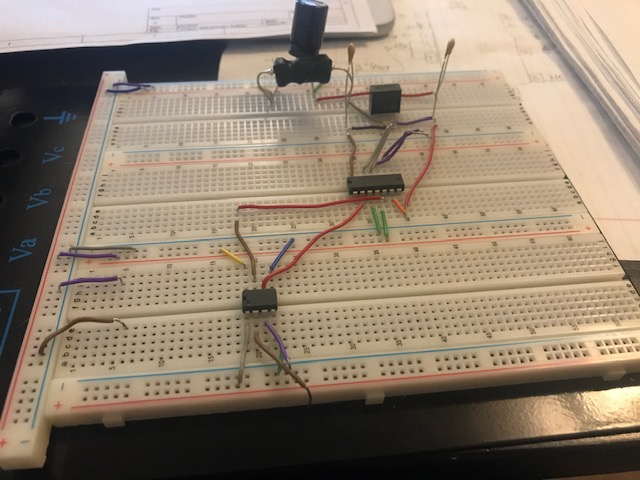
Then I realized that those loops could introduce unwanted inductance, so I revised.
Figure 3: Revised breadboard with no loops. Consists of Repeater RS-485, DC-DC converter and Digital Isolator
As you can see, they look so much better! FLAT. You’d want them flat like that. It’s a tedious work, but I shall get used to it.
For multigiga serial links (with increasing bitrates), it would suffer from signal distortions. While SerDes receiver designed to compensate those distortions, by creating a bigger eye opening (see: eye diagram) for reliable sampling, the bit rates also rising faster than Rx, PCB, and package HDI. This results in decreasing reachable total channel. RS-485 is a type of repeater that could restore the signals, hence RS-485 extending the channel reach.
RS-485 use differential signaling over twisted pair, which is beneficial. We know from circuit theory, that differential signaling technique reduces electromagnetic interference (EMI) that could cause cross-talk. In addition, RS-485 also use 3-state logic (1, 0 and high Z) that allows individual transmitter to be deactivated.
The schematic and circuit board above (see Figures 1,2,3), uses RS-485 as a repeater and it connected it to digital isolator to ensure the power-supply voltage to the MCU is compatible and DC-DC converter to rectify the whole process back to the DC.
If you notice, the circuit diagram for DC-DC converter contains Inductor(L) and Capacitor (C). The LC circuit is a simple low pass filter to filter out unwanted signals that may present above the wanted pass band.
So in theory, once we connect all of these out to the UTP cable, 50m cable should not signal faster than 2Mbit/s. We’ll see!
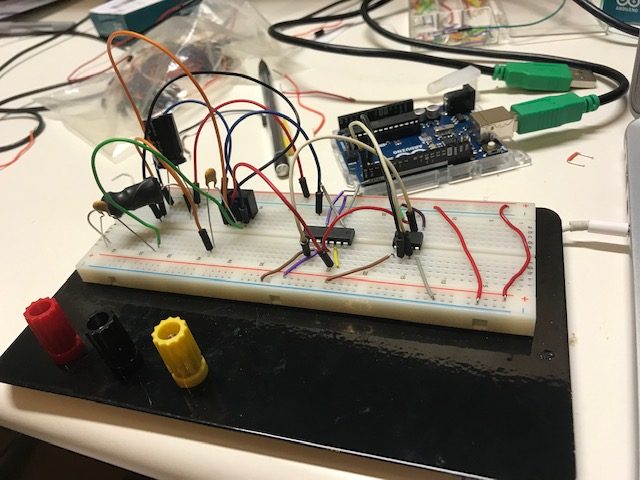
It’s been a quiet week, but I managed to review and ordered few things that I needed to get for my on going project. By next week I should be getting my DC-DC converter, Digital Isolator, RS-485 transceiver, and some passive components. I might post the detail on why or how to pick these components to make it compatible to your microcontroller (MCU).
Further, why did I mention eye diagram on the topic? What is eye diagram?
Since Signal Integrity is the main topic of my project, an eye-diagram, which is an oscilloscope display (literally it look like an eye), could tell us the quality of serial bit stream and it can be used to debug signal integrity issues. According to Sciencedirect, amplitude noise and timing jitter could impact our system’s performance. However, using simple Bit Error Rate (BER) measurement alone can’t tell the difference between amplitude noise and timing jitter. Eye diagram, on the other hand, provides more information regarding both issues.
Figure 1: Diagram of Eye Pattern. Picture Credit: sciencedirect.com
We can take high-bandwidth instantaneous samples of high speed digital signal and the sum of the samples (superimposing ‘0’ and ‘1’) are the eye diagram! To make it more clear, just remember those timing diagram you did in your System Verilog class. The eye diagram would look EXACTLY like one of those state diagrams!
I was playing with my oscilloscope earlier to display the eye diagram ( I own Tektronix TBS1102B), and unlike the advanced version, I had to manually set up the closest eye diagram I can get from it (see short video below) and I was using high baud rate (2Mbps) to demonstrate the best display of eye diagram.
From this short clip, we can see clearly the transition state from High to Low and so on.
If you are using the same type of Oscilloscope, this can be accomplished by running code above (connect it with your Arduino, of course), Autoset it, then pick sample (by adjusting the horizontal knob) to the non-static rising edge, then select utility > display > enable persist (to as long as you want).
ps: I found this artwork (or maybe enlarged screenshot) on Instagram and I want one for my office! lol
Happy weekend to all of you! We had heavy rain on Saturday morning, and it was nice and good for my plants.
We did a simple linear test with Arduino by using the Tx pin (USART) and to test the highest baud rate it can handle before it introduce some weird stuff on oscilloscope.
//Again, pin#4 being LOW means for HIGH Z
//the baud rate in this code is the highest rate that we tested and it had some nasty wave on oscilloscope
void setup() {
  Serial.begin(2500000);
  pinMode(4, INPUT);
  digitalWrite(4, LOW);
}
void loop() {
   Serial.write(0xAA);
}
Baud Rate(Bps)
Period ( μs)
Frequency(Hz)
9600
~104.2
9596
19200
~52.07
19204
38400
~26.04
38402
76800
~13.02
76804
153600
~6.512
153562
230400
~4.509
221778
460800
~2.004
499001
921600
~1.002
998003
1843200
~0.5012
1995000
2000000
~0.5011
1995609
2500000
~0.5014
1995609
Based on data above, we noticed that although it maintain the linear behavior, the higher the baud rate (the corresponds frequency value should be very close to the baud rate), the higher the deviation of the frequency rate.
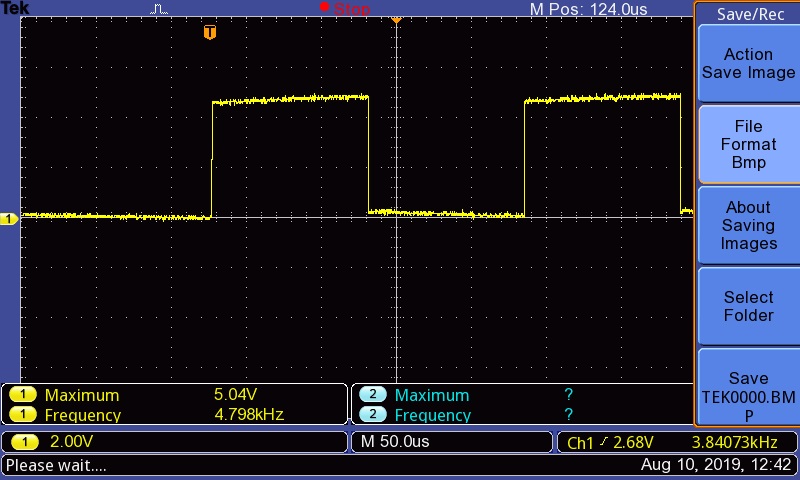
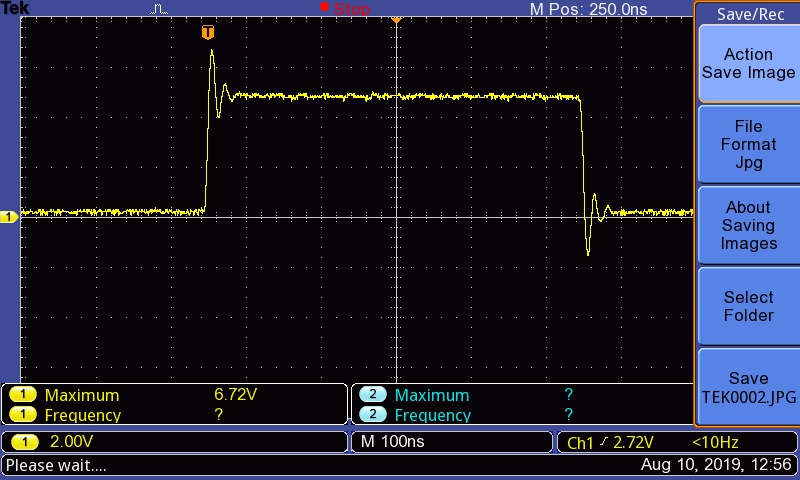
Check out the screenshots from two different baud rate:
Period: 124 microseconds Period: 250 nanoseconds
Just by eyeballing those two screenshots, we know that at period 250nanoseconds, the square wave behave abnormally (it has some negative peak, which we don’t want).
We could say that it is feasible to transmit 1Mbs, BUT definitely less than 2.5Mbs!
Tomorrow we will use two Arduino to test both Tx and Rx modules. That’s all for now, enjoy the rest of your weekend.
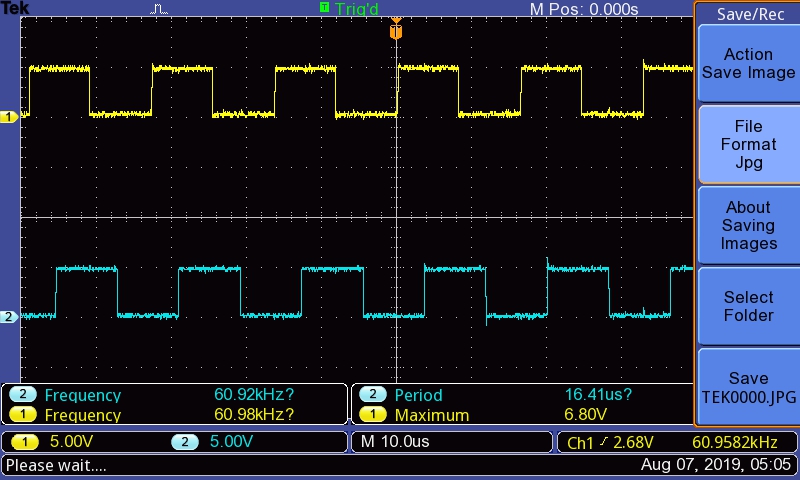
Few days ago I received my some of the tools for my electronic projects (such as: oscilloscope, Arduino and Multimeter). We (William and I), configured an Arduino to test the oscilloscope by creating a simple square waves. Based on today’s experiment, we accomplished/discovered two interesting things:
Near perfect square wave with no phase shift (117kHz frequency).
We tested to see the frequency for 50% (no scale) by using analogWrite() function (reference).
For this configuration, we noticed no phase shift on the analog side of the equation. However, after we tested with digitalWrite() (see reference), we noticed 1/4 of phase shift on our square wave (will update with image later).
To solve this clock slips/phase shift problem, we did a little research and concluded that one of the reasons of the shift problem is due to interruption on the main (Arduino) code. Hence, we modified the code by adding noInterrupts() (see: reference).
//The commented code were used to test elimination of phase
// shift before using the noInterrupts() function
//unsigned int usdelay =1;
void setup() {
  noInterrupts();
  pinMode(3,OUTPUT);
  pinMode(4,OUTPUT);
  digitalWrite(3, LOW);
  digitalWrite(4, LOW);
}

void loop() {
  // put your main code here, to run repeatedly:
  digitalWrite(3, HIGH);
  digitalWrite(4, HIGH);
  //delayMicroseconds(usdelay);
  digitalWrite(3, LOW);
  digitalWrite(4, LOW);
  //delayMicroseconds(usdelay);
}
Figure 1: Output waves on Oscilloscope for two Pins
For amplitude 5V, we managed to produce desired frequency: 117kHz (1 pin as INPUT) or 60.9kHz (for two pins as INPUT) without phase shift with the noInterrupts() solution.
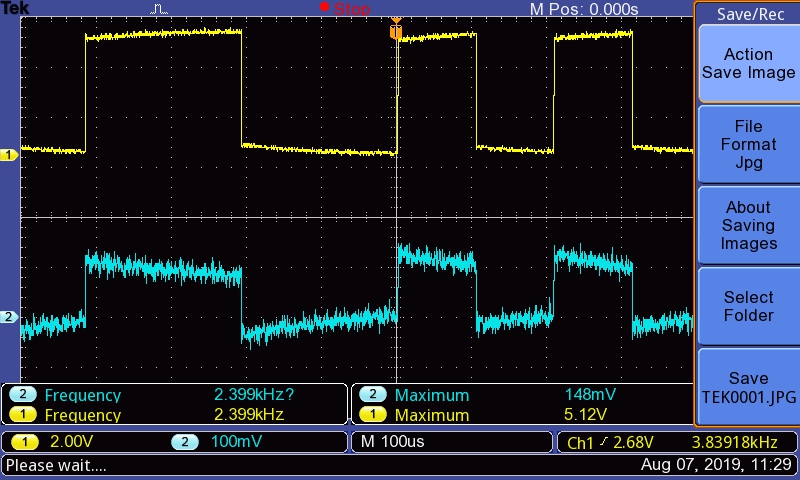
2. Cross-talk problem using serial connection
We tested the serial connection with 9600bps and using 0xAA (Binary: 1010 1010 <– you can also imagine this as LOW, HIGH, LOW, HIGH,…, HIGH) pattern, and somehow our configuration introduced a cross-talk problem from the pin#4 we set-up as input (!!!).
void setup() {
  Serial.begin(9600);
  pinMode(4, INPUT);
  digitalWrite(4, LOW);// pin#4 LOW means High Z
  }

void loop() {
  Serial.write(0xAA);
}
Figure 2: Cross-talk issue for serial test
As we can see from Figure 2, channel 2 (blue) is the square wave from pin#4 and channel 1 (yellow) is the square wave from the serial connection (tx) from the Arduino. We noted that the amplitude of the pin#4 is very low (148mV) compared to the amplitude of channel 1 (5.12V).